The game in the figure is shown using a:
This figure displays the choices being made by two coffee shops: Starbucks and Dunkin Donuts. Both companies are trying to decide whether or not to expand in an area. The area can handle only one of them expanding, and whoever expands will cause the other to lose some business. If they both expand, the market will be saturated, and neither company will do well. The payoffs are the additional profits (or losses) they will earn.
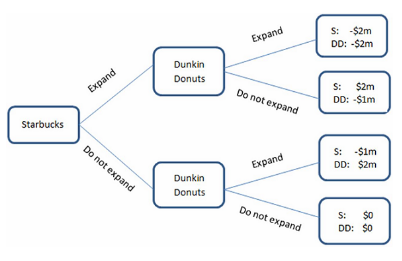
A. decision tree.
B. decision matrix.
C. flowchart.
D. graph.
A. decision tree.
You might also like to view...
"Higher ethanol production definitely and directly raises the price of corn," said USDA economist Ephraim Leibtag. In the short run, what is TRUE if the production of ethanol increases?
A) The demand for corn will increase. B) The supply of ethanol will decrease. C) The supply of corn will increase. D) The demand for ethanol will increase.
A major objective of tax policy should be to
a. avoid distortions in resource allocation while raising revenue b. divert savings from the private to the public sector c. increase the government's ability to direct the economy d. supplement resources entering the country from foreign aid e. all of the above
Which of the following explains the rapid growth of the M2 money supply growth since the 1960s?
a. inflation b. the government printed more M2 money than M1 c. the introduction of money market mutual funds d. the introduction of money market mutual deposits e. sluggish stock market performance in the 1970s
The relative decline in manufacturing in the United States has contributed to the decline in unionization.
Answer the following statement true (T) or false (F)