Solve the problem.The following data represents the average monthly minimum temperature for a certain city in California. 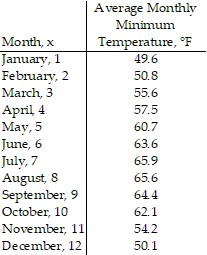 Draw a scatter diagram of the data for one period. Find a sinusoidal function of the form
  that fits the data. Draw the sinusoidal function on the scatter diagram. Use a graphing utility to find the sinusoidal function of best fit. Draw the sinusoidal function of best fit on the scatter diagram.
What will be an ideal response?
y = 8.33 sin (0.50x - 2.06) + 57.97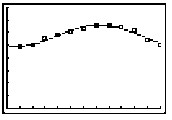
You might also like to view...
Graph the function.y = 
A. 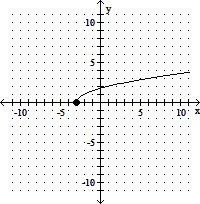
B. 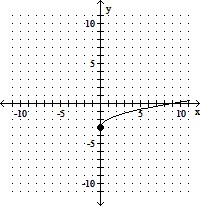
C. 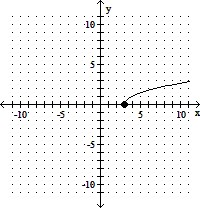
D. 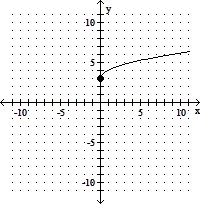
Add or subtract the rational numbers. Express the sum or difference as a rational number in lowest terms. +
+ 
A. 
B. 
C. - 
D. - 
Find the indicated unit rate.In a region, the total number of students enrolled in public schools in a recent year was 426,593. At the same time, there were 23,312 public school teachers. Write a unit rate of students to teachers. Round to the nearest whole number.
A. 18 students for every teacher B. 19 students for every teacher C. 20 students for every teacher D. 17 students for every teacher
Solve the problem.Find the radius of a circle in which a central angle of  radian determines a sector of area
  meters. Round to the nearest hundredth.
A. 14.76 m B. 7.38 m C. 108.86 m D. 10.43 m