Make a bar graph to represent the data.The following table shows the number of inches of rainfall measured at City X during the following days. Create a horizontal bar graph.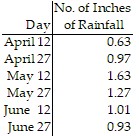
What will be an ideal response?
Answers may vary. The following is a possible answer.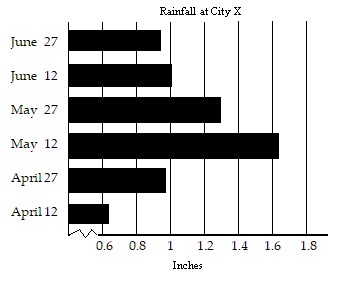
You might also like to view...
Provide an appropriate response.Simplify by applying the distributive principle and combining like terms: 
Fill in the blank(s) with the appropriate word(s).
Verify the identity. = - sin(2?)
What will be an ideal response?
Provide an appropriate response.For the graph of the inequality  , if the coordinates of a test point place it on one side of the line
  , and that test point happens to satisfy the inequality, then what can be said about other points lying on the same side of the line? What can be said about the points on the other side of the line?
What will be an ideal response?
Find the following using a calculator. Round to four decimal places.log 94
A. 5.0433 B. 1.4731 C. 1.9731 D. 4.5433