Refer to the graph shown. When price declines by 11 percent, quantity supplied falls by 8 percent. Which curve best demonstrates the elasticity in this example?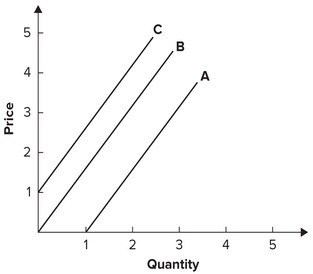
A. A
B. B
C. C
D. None of the answers is correct.
Answer: A
You might also like to view...
Advocates of flexible exchange rates claim that under flexible exchange rates
A) enhanced control over fiscal policy would allow countries to dismantle their distorting barriers to international payments. B) reduced control over monetary policy would allow countries to dismantle their distorting barriers to international payments. C) enhanced control over monetary policy would allow countries to increase their distorting barriers to international payments. D) enhanced control over monetary policy would allow countries to dismantle their distorting barriers to international payments. E) enhanced control over monetary policy would destabilize exchange rates.
Assuming that clothing is a normal good, an increase in consumer income, other things being equal, would:
a. increase the demand for clothing. b. decrease the demand for clothing. c. increase the quantity of clothing demanded. d. decrease the quantity of clothing demanded
The marginal propensity to consume (MPC) is computed as the change in consumption divided by the change in:
a. GDP. b. income. c. saving. d. none of these.
Technically speaking, maximizing profit means finding the maximum difference between
a. TR and TC b. MR and MC c. price and ATC d. price and AR e. ATC and MC