Graph the function f by starting with the graph of y = x2 and using transformations (shifting, compressing, stretching, and/or reflection).f(x) = -  x2
x2 
A. 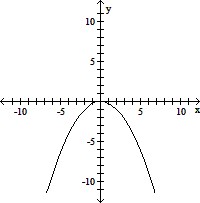
B. 
C. 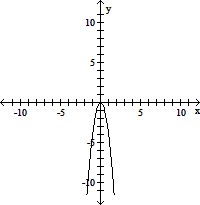
D. 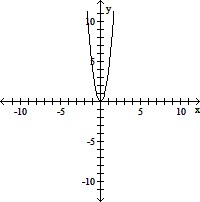
Answer: A
Mathematics
You might also like to view...
Integrate the function. dt
dt
A. -  + C
+ C
B. -  + C
+ C
C. -  + C
+ C
D. -  + C
+ C
Mathematics
Simplify the expression. Assume that all variables are positive when they appear. ?
? 
A. 
B. 3
C. 
D. 3
Mathematics
Use the discriminant to determine the number of real solutions.s2 - 2s - 3 = 0
A. One real solution B. No real solutions C. Two real solutions
Mathematics
Solve the problem.The table shows the number of sales of scooters y, in thousands, x months after they are introduced on the market. Use regression to find a logistic function f that models this data. Round the constants to the nearest hundredth.
A. f(x) = 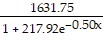
B. f(x) = 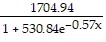
C. f(x) = 
D. f(x) = 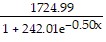
Mathematics