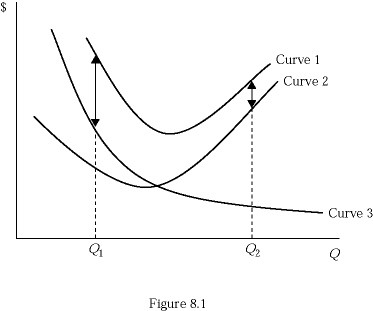
 Refer to Figure 8.1, which shows a family of average cost curves. Why does the vertical distance between Curve 1 and Curve 2 decrease as output increases from Q1 to Q2?
A. Because average variable cost first decreases, then increases as output increases from Q1 to Q2.
B. Because average fixed cost decreases as output increases from Q1 to Q2.
C. Because average total cost first decreases, then increases as output increases from Q1 to Q2.
D. Because average variable cost increases faster than average fixed cost as output level approaches Q2.
Answer: B
You might also like to view...
According to the statistics, the distribution of money income:
a. fluctuated widely since 1947. b. changed significantly in favor of the bottom 5 percent. c. has not changed greatly since 1947. d. has not changed greatly since 1929.
Assume the table has recorded the total output and prices of the only two goods produced. Looking at the changes in real GDP and nominal GDP from 2000 to 2001, we can conclude that because:
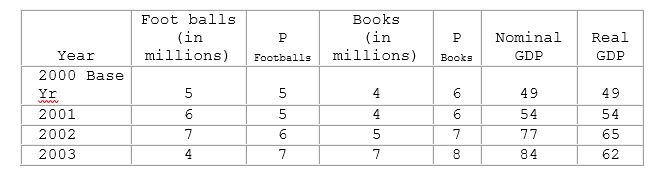
A. real and nominal GDP increased at the same rate, there was no change in prices, only output.
B. nominal GDP rose more than real GDP, both prices and output must have increased.
C. real GDP rose more than nominal GDP, output must have increased more than prices.
D. real and nominal GDP increased at the same rate, there was no change in output, only prices.
Are there ever exceptions to the law of demand?
The value of a business owner's time is an example of
a. an opportunity cost. b. a fixed cost. c. an explicit cost. d. total revenue.