According to the graph shown, the change to government revenue brought about by the introduction of a tariff to an economy once operating under free trade is:
This graph demonstrates the domestic demand and supply for a good, as well as a tariff and the world price for that good.
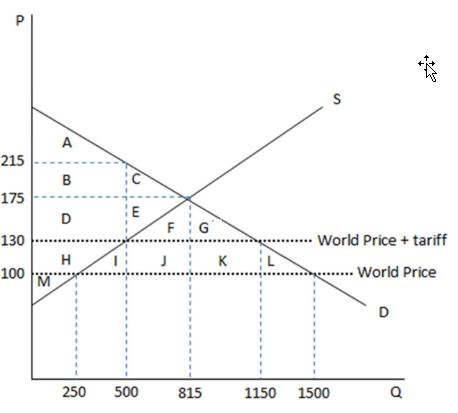
A. an increase of area JK.
B. an increase of area FGJK.
C. an increase of area IJKL.
D. a decrease of area IL.
A. an increase of area JK.
You might also like to view...
Education
A) does not really add to one's human capital. B) does not really affect one's income. C) is a major factor affecting one's income. D) explains all the differences in male-female incomes.
Who loses surplus when consumers in a market are forced to pay a Pigouvian tax for a negative externality?
A. Producers B. Consumers C. Others affected by the externality D. Both producers and consumers lose surplus when negative externalities are internalized.
An industry in which 5 firms each have a 10 percent market share and 50 firms each have a 1 percent market share will have a Herfindahl index equal to:
A. 1,100. B. 500. C. 550. D. 1,500.
Which of the following statements is correct?I.When economists derive the aggregate demand curve, they are looking at the effect of the price level on one commodity only.II.Any non-price-level change that increases total planned real spending on domestic goods shifts the AD curve to the right.
A. I only B. II only C. Both I and II D. Neither I nor II