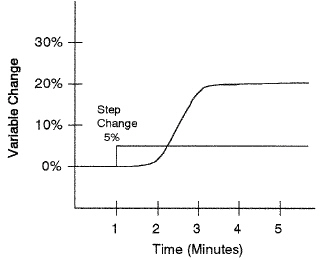
 Figure 12-2a Use the graph in Figure 12-2a and Table 12-2b to answer the following questions using the Ziegler-Nichols Reaction Curve tuning method.a. What is the reaction rate of the process shown on the graph?b. What is the unit reaction rate of the process shown on the graph?c. What is the effective delay?Determine the following settings for a two-mode controller.d. proportional settinge. integral setting
Controller ModeProportional Gain Kc
Proportional Band PB
Reset Time Ti (Minutes per Repeat)
Reset Rate Tr (Repeats per Minute)
Derivative Time Td
P
Kc = 1/R1D
PB = 100R1D
N/A
N/A
N/A
PI
Kc = 0.9/R1D
PB = 110R1D
3.33D
0.3/D
N/A
PID
Kc = 1.2/R1D
PB = 83R1D
2D
0.5/D
0.5D
Table 12-2b
What will be an ideal response?
a. Reaction Rate(R) = B/A = 20%/1 minute = 20%
b. Unit Reaction Rate(R1) = Reaction Rate (R)/Step Change (X) = 20%/5% = 4
c. D = 2 minutes - 1 minute = 1 minute
d. P = 110R1D = 110 ´ 4 ´ 1 = 440
e. Ti = 3.33D = 3.33 ´ 1 = 3.33 Or .3 repeats/min
You might also like to view...
Una unidad eléctrica portátil que se puede utilizar para cortar roscas, manejar mecanismos para levantar cargas y malacates y para operar grandes válvulas es _____.
a. un punzón b. una unidad impulsora c. una biseladora d. una máquina de corte
A resistor drawn with an arrow through it is the symbol for a variable resistor.
Answer the following statement true (T) or false (F)
The approximate direction of the boundaries can be found with a handheld _______.
A. Compass B. Scale C. Pendulum D. Engineers scale
The role of the veterinarian will likely increase as animal units continue to increase in
size. A. True B. False