Determine whether the following is the graph of a function.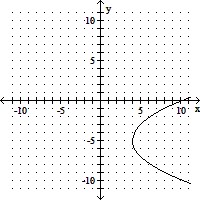
A. Yes
B. No
Answer: B
You might also like to view...
Write the number in scientific notation.0.000075
A. 7.5 × 10⁶ B. 7.5 × 10⁵ C. 7.5 × 10⁻⁵ D. 7.5 × 10⁻⁶
Solve the problem.The percentage of Americans owning a car with a cassette tape player during particular years is given in the following table: Let t be the number of years since 1992. Find a linear function, f(t), for the line containing the points
  and
and  . Find P(9). What does this situation mean?
A. f(9) = 44.2. In 2001, 44.2% of the population owned a car without a cassette player. B. f(9) = 44.2. In 2001, 44.2% of the population owned a car with a cassette player. C. f(9) = 42.4. In 2001, 42.4% of the population owned a car with a cassette player. D. f(9) = 42.4. In 2001, 57.6% of the population owned a car with a cassette player.
Simplify the expression. Assume all variables represent positive real numbers.2 + 14
+ 14
A. 13
B. 16
C. -12
D. -17
Perform the indicated computation. Write the answer in scientific notation.
A. 48 × 10-6 B. 6 × 10⁵ C. 6 × 10⁻⁵ D. 48 × 106