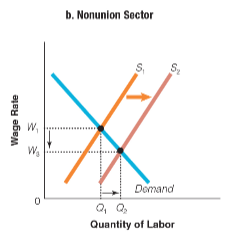
What is being depicted in this graph showing the nonunion sector?
a. When the number of workers decreases from W 1 to W 3 , the salaries and quantity of
labor increase in an inverse relationship.
b. By increasing supply from S 1 to S 2 , workers unable to get jobs in the union sector
increase the wages in the nonunion sector.
c. In the nonunion sector, wage rates, labor supply, and quantity of labor are all less
than they are in the union sector.
d. Workers unable to get union jobs are forced into the nonunion sector, where the
increased supply of labor drives down wages.
d. Workers unable to get union jobs are forced into the nonunion sector, where the
increased supply of labor drives down wages.
You might also like to view...
Frank is given the choice between pizza and hotdogs and chooses pizza. Then, before serving him, his host tells Franks he could have a hamburger. Frank says he wants a hot dog. Which of the properties of Arrow's impossibility theorem does Frank violate?
Variable inflation rates may be more costly socially than low but predictable rates of inflation.
Answer the following statement true (T) or false (F)
Perfectly competitive markets tend to have a ______ number of sellers and a(n) ______ entry.
a. large; easy b. large; difficult c. small; easy d. small; difficult
If the number of people with the skills necessary to perform a job decreases, labor ________ shifts to the ________.
A. demand; left B. demand; right C. supply; left D. supply; right