Solve the problem.The paired data below consist of the temperatures on randomly chosen days and the amount a certain kind of plant grew (in millimeters). Find the equation of the least-squares regression line that models the data.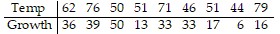
A. y ? -14.6 - 0.211x
B. y ? 14.6 + 0.211x
C. y ? 7.30 - 0.112x
D. y ? 7.30 + 0.122x
Answer: B
You might also like to view...
Evaluate the surface integral of the function g over the surface S.G(x, y, z) = x3y3z3; S is the surface of the rectangular prism formed from the coordinate planes and the planes x = 3, y = 2, and z = 3
A. 30618
B. 2187
C. 
D. 
Solve. Remember to insert units when writing your answer.A container holds  quarts of liquid. How many fluid ounces is this?
A. 24 fl oz B. 6 fl oz C. 12 fl oz D. 3 fl oz
The following comparison line graph indicates the number of vehicles sold for a seven week period by two different salespeople. Use the graph to answer the question.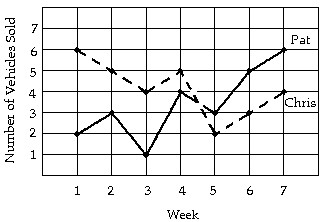 In the first week, how many vehicles did Chris sell?
A. 2 vehicles B. 1 vehicle C. 6 vehicles D. 4 vehicles
Factor.64c3 + 729
A. (4c - 9)(16c2 + 36c + 81) B. (4c + 9)(16c2 + 81) C. (64c + 9)(c2 - 36c + 81) D. (4c + 9)(16c2 - 36c + 81)