Graphically, producer surplus is the area:
a. above the equilibrium price and below the demand curve.
b. below the equilibrium price and below the supply curve.
c. above the supply curve and below the demand curve.
d. below the equilibrium price and above the supply curve.
e. below the equilibrium price and above the demand curve.
d
You might also like to view...
What explains the increase in supply and fall in price of HDTVs during from 2010 to 2015?
A) Technological innovations that reduced the cost of production B) Fewer producers in the industry C) A fall in demand for HDTVs as more people turned toward superior substitutes D) None of the above.
According to the classical theory, an inward shift in aggregate demand would reduce
A) real Gross Domestic Product (GDP) and the price level. B) the price level but have no effect on real Gross Domestic Product (GDP). C) real income but have no impact on the price Gross Domestic Product (GDP). D) the price level but increase real Gross Domestic Product (GDP).
In a market with barriers to entry:
A. the implications of Adam Smith's theory of the invisible hand can be expected to hold. B. prices will direct productive resources toward underserved markets. C. firms will earn zero economic profit in the long run. D. economic profit will not fall to zero in the long run.
The following payoff matrix shows the outcomes for the United States and Russia from relying on conventional weapons versus atomic weapons in a military conflict. The percentages refer to the fraction of the population that would die.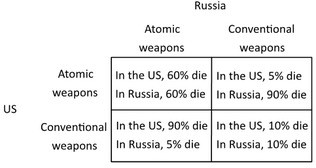 This situation above illustrates a positional externality because:
A. using atomic weapons improves each country's outcome but hurts the other country. B. the game does not have a Nash equilibrium. C. using atomic weapons is a dominated strategy. D. no matter what kind of weapons each country chooses, many people will die.