Epidemic curves were prepared by plotting number of cases of disease on the Y-axis and dates on the X-axis. Graph would show a single prominent spike, restricted to a few days.
A. Propagated Epidemic
B. Point-source Epidemic
C. Common-source Epidemic
B. Point-source Epidemic
You might also like to view...
Describe the mechanisms by which certain prokaryotes glide. What are the ecological advantages of gliding motility?
What will be an ideal response?
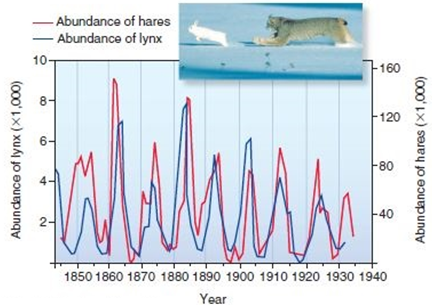
Scientists have discovered that when they provide supplemental food for hares, their density tripled. The figure above shows cycles of lynx and hare populations over a century's time. What do you predict would happen to the lynx and hare populations in an area where hares were provided supplemental food for one year?

A. The lynx population and the hare population would increase simultaneously, and stay at a stable high level permanently.
B. The hare population would increase, but the lynx population would be unaffected.
C. The lynx population would decrease as hares increased due to exploitative competition, then slowly rise back to the original level.
D. The lynx population would increase 1-2 years after the hares increased, then both would continue cycling down and up.
Sympatric species
A. are more likely than allopatric species to display character displacement. B. always show character displacement. C. are less likely than allopatric species to display character displacement. D. are unlikely to be competing.
A rural farm worker is brought to the clinic, experiencing a cluster of nodular skin lesions on his arm. Some of the lesions have ulcerated. The worker indicates that he frequently gets scratches and abrasions on his hands and arms and that the first nodule appeared several weeks after he had removed a sliver. The nodules have been progressing slowly for the past six weeks. What is the most likely infection?
A. Necrotizing fasciitis B. Candidiasis C. Subcutaneous mycosis D. Erysipelas