Give an appropriate answer.The following table shows the number of rodeos in a certain state from 2008 through 2012. 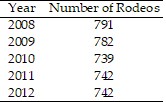 Draw a line graph that makes the decrease in numbers look small.
What will be an ideal response?
Answers may vary. One possible solution: 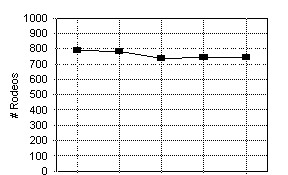
| 2008 | 2009 | 2010 | 2011 | 2012 |
| Year |
Mathematics
You might also like to view...
Solve the problem.An airplane is flying in the direction 70° west of north at 674 km/hr. Find the component form of the velocity of the airplane, assuming that the positive x-axis represents due east and the positive y-axis represents due north.
A. 
B. 
C. 
D. 
Mathematics
Find the length of the third side of the right triangle. Assume that c represents the length of the hypotenuse. Give an exact answer and, if appropriate, an approximation to three decimal places.b = 12, c = 15
A. a = 10 B. a = 81 C. a = 9 D. a = 3
Mathematics
Graph the function.f(x) = 3-x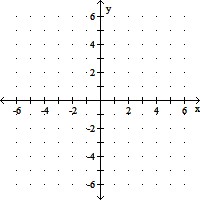
A. 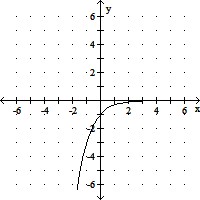
B. 
C. 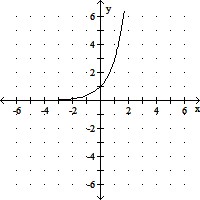
D. 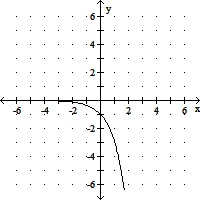
Mathematics
Simplify. Assume that variables in the radicand are greater than or equal to 0.![]()
A. ![]()
B. ![]()
C. ![]()
D. none of these
Mathematics