Use the graph to answer the question. 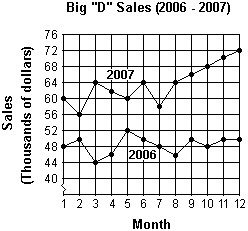 What were the total sales for the first 6 months of 2006?
A. $366,000
B. $240,000
C. $46,000
D. $290,000
Answer: D
Mathematics
You might also like to view...
The following table shows total sales S, in dollars, t months after the first of the year. Use linear regression to model sales as a function of months since the first of the year. t 2 3 6 7 S 7539.36 11018.49 22235.76 25796.81
What will be an ideal response?
Mathematics
Solve the inequality. Express your answer using interval notation.-11 ? -2x + 3 ? -1![]()
A. (2, 7)![]()
B. [2, 7]![]()
C. (-7, -2)![]()
D. [-7, -2]![]()
Mathematics
Provide an appropriate response.Look for a pattern in the sequence of figures shown below. How many squares are needed for the 4th figure? The nth figure?
A. 13, 4n - 3 B. 14, 4n + 3 C. 13, 3n + 1 D. 12, 4n - 2
Mathematics
Use the horizontal line test to determine whether the function is one-to-one.
A. Yes B. No
Mathematics