Find the standard deviation. Round to one more place than the data.196, 205, 215, 185, 229, 278, 165
A. 36.2
B. 30.2
C. 12.7
D. 33.1
Answer: A
You might also like to view...
Simplify the expression.
?
 ?
Write the answer without using negative exponents. Assume that the variable is restricted to those numbers for which the expression is defined.
?
?
Write the answer without using negative exponents. Assume that the variable is restricted to those numbers for which the expression is defined.
?
A. 
B. ?
C. ?
D. ?
Provide an appropriate response.A linear programming problem has objective function 4x and constraints x ? a-x ? -b x ? 0where a and b are positive numbers and b > a.Does a maximum exist for the objective function? If not, why not? Does a minimum exist? If not, why not?
A. Neither maximum nor minimum exist as the feasible set is the empty set. B. Maximum and minimum both exist. C. Maximum does not exist as the objective function may be arbitrarily large (unbounded). Minimum does exist. D. Maximum exists. Minimum does not exist as the objective function may be arbitrarily small (unbounded).
Perform the division.
A. 2x2 - 8 + 
B. 2x2 - 8 + 
C. 2x - 8 + 
D. 2x - 8 + 
Solve the problem.The following table shows the number of DWI arrests in a county for the years 1994-1998, where 1 represents 1994, 2 represents 1995, and so on.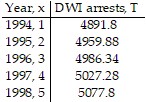 This data can be approximated using the third-degree polynomial T(x) = -0.65x3 + 0.59x2 + 59.86x + 4832.Use the Leading Coefficient Test to determine the end behavior to the right for the graph of T. Will this function be useful in modeling the number of DWI arrests over an extended period of time? Explain your answer.
A. The graph of T increases without bound to the right. This means that as x increases, the values of T will become large and positive and, since the values of T will become so large, the function will no longer model the number of DWI arrests. B. The graph of T decreases without bound to the right. Since the number of larceny thefts will eventually decrease, the function T will be useful in modeling the number of DWI arrests over an extended period of time. C. The graph of T approaches zero for large values of x. This means that T will not be useful in modeling the number of DWI arrests over an extended period. D. The graph of T decreases without bound to the right. This means that as x increases, the values of T will become more and more negative and the function will no longer model the number of DWI arrests.