The aggregate supply curve shows for each price level the
a. total amount of money supply at each price level.
b. amount of frictional unemployment that will occur.
c. amount of structural unemployment that will occur.
d. quantity of goods and services that businesses are willing to produce.
d
You might also like to view...
During his tenure at the helm of the Federal Reserve System, Paul Volcker reestablished ________
A) a system of fixed exchange rates B) the role of open market operations in the monetary policy actions of the Fed C) the credibility of the Federal Reserve as an inflation fighting institution D) the targeting of monetary aggregates, like the fed funds rate
Using a flow chart, illustrate the effects of contracting the money supply in a country with floating exchange rates.
What will be an ideal response?
The Federal Trade Commission was created by Congress in the same year that the Clayton Act was passed.
Answer the following statement true (T) or false (F)
Answer the question based on the following data, using year 1 as the base year. All dollars are in billions.
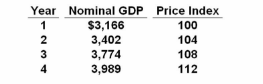
Refer to the above data. Real GDP increased from year 3 to year 4 by approximately:
A.
$68 billion
B.
$75 billion
C.
$98 billion
D.
$215 billion