Refer to the graphs, in which the numbers in parentheses near the AD1, AD2, and AD3 labels indicate the level of investment spending associated with each curve. All figures are in billions. The economy is at equilibrium at the intersection of the aggregate supply curve and aggregate demand curve AD3. What policy should the Fed pursue to achieve a noninflationary full-employment level of real GDP?
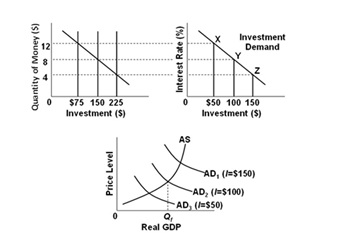
A. Increase the money supply from $75 to $150 billion
B. Increase the money supply from $150 to $225 billion
C. Decrease the money supply from $225 to $150 billion
D. Make no change in the money supply
A. Increase the money supply from $75 to $150 billion
You might also like to view...
The relative price of a good is greater than the money price of a good
Indicate whether the statement is true or false
The monetary base consists of:
A) currency plus reserves. B) currency plus required reserves. C) currency plus excess reserves. D) currency plus demand deposits.
Assuming the market is in equilibrium in the graph shown with demand D and supply S1, consumer surplus is:
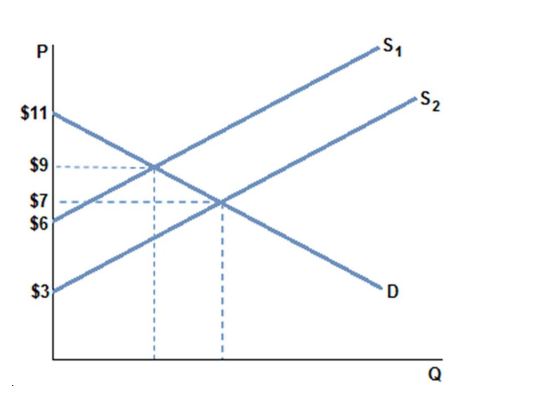
A. greater than consumer surplus when market is in equilibrium at D and S2.
B. less than consumer surplus when market is in equilibrium at D and S2.
C. the same as consumer surplus when market is in equilibrium at D and S2.
D. zero.
The Capital Asset Pricing Model determines the weighted average cost of capital
Indicate whether the statement is true or false