List the intercepts of the graph. 
A. (-9, 0), (0, -9), (0, 9), (9, 0)
B. (-9, 0), (0, -9), (0, 0), (0, 9), (9, 0)
C. (-9, 0), (0, 9)
D. (0, 9), (9, 0)
Answer: A
You might also like to view...
Use the Consumer Price Index below to answer the question.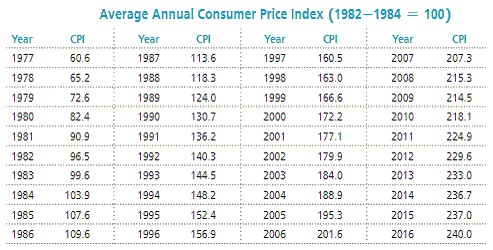 In 1995, the price of gasoline was 120.5 cents per gallon. In 2000 it was 155.0 cents per gallon. Find the relative change in the price of gasoline over that period and compare it to the overall rate of inflation as measured by the CPI. In real terms, was gasoline more expensive in 1995 or 2000? If necessary, round values to the nearest tenth.
What will be an ideal response?
Use the information given in the table to solve the problem.The table gives the value of a 1957 Chevy BelAire in #2 condition for selected years. What is the percent change (to the nearest tenth of a percent) in the value of a 1957 Chevy BelAir in #2 condition from 1982 to 1986.
A. 30.3 % B. 25.9 % C. 21.3 % D. 25 %
Solve the problem. Round to the nearest tenth if necessary.By switching service providers, a family's telephone bill decreased from about $50 a month to about $46. What was the percent of decrease?
A. 8.7%
B.
| 4% |
C. 8%
D. 9%
Find the vertical asymptotes of the rational function.g(x) = 
A. x = -6 B. x = 6 C. x = -6, x = 6 D. x = 36