Figure 44.14
?
The following question refers to the age structure diagrams above.
Which statement reflects the age structure of these three countries?
A. India has the greatest proportion of older adults.
B. The United States has the greatest proportion of young people.
C. India has the greatest proportion of young people.
D. China has the greatest proportion of young people.
E. China has the greatest proportion of older adults.
Answer: C
You might also like to view...
Which of the following statements concerning the corpus luteum is INCORRECT?
A. Secretions of the corpus luteum inhibit LH and FSH secretion. B. Secretions of the corpus luteum prepare the uterus for implantation of the embryo. C. Secretions of the corpus luteum prevent the maturation of primary oocytes. D. The major hormone secreted from the corpus luteum is progesterone. E. The major hormone secreted from the corpus luteum is estradiol.
Why does NADH produce more energy than FADH2?
a. FADH2 donates electrons to protein complex III as opposed to complex II. b. FADH2 requires more ATP to produce it and gives more energy back. c. NADH and FADH2 are synthesized in different steps of cellular respiration. d. NADH donates electrons to a higher energy acceptor in the electron transfer chain. e. NADH supplies fewer electrons that are of a higher energy state than FADH2.
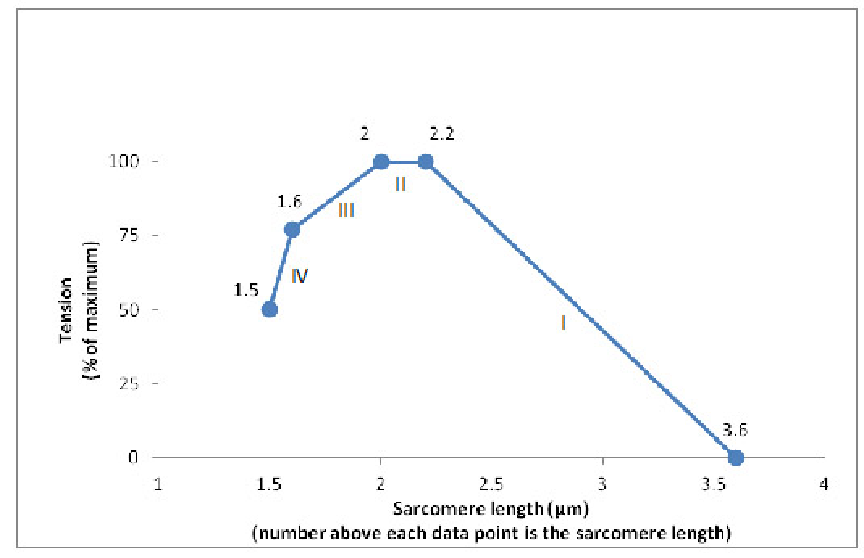
The sliding filament model for muscle contraction can be studied using an isolated skeletal muscle that is fixed at each end, while a machine records the tension that is generated when the muscle is stimulated to contract. In one particular muscle tested, the length of the thick filaments was 1.6 mm and the length of the thin filaments that project in from each Z line towards the center of the sarcomere was 1.0 mm. A summary of the results comparing sarcomere length to the degree of tension produced during contraction is shown below. What most likely explains the difference between segment II and segment III of the graph?

A. The muscle cells used up all the ATP by the end of segment II.
B. The length of the thin filaments is decreasing in segment III but not in segment II.
C. There is an increasing overlap of the free ends of the thin filaments in segment III but not in segment II.
D. The length of the thick filaments is decreasing in segment III but not in segment II.
E. The distance between the Z lines is constant in segment II but rapidly increasing in segment III.
F. Fewer myosin cross-bridges are forming in segment II than in segment III.
Clarify Question
· What is the key concept addressed by the question?
· What type of thinking is required?
Gather Content
· What do you know about the correlation between sarcomere length and tension? What other information is related to the question?
Choose Answer
· Given what you now know, what information is most likely to produce the correct answer?
Reflect on Process
· Did your problem-solving process lead you to the correct answer? If not, where did the process break down or lead you astray? How can you revise your approach to produce a more desirable result?
Suppose you are estimating the following model: Yi = ?0 + ?1Xi + Ui. You believe the variance of the unobserved factors (U) varies with X. If this is true, what is the consequence?
A. Your estimate of ?0 will be biased. B. Your estimate for ?0 and ?1 will be biased. C. Your estimate for ?1 will be biased. D. None of the above answers is correct