A subsidy to buyers has been placed in the market in the graph shown. Why might the government enact such a policy?
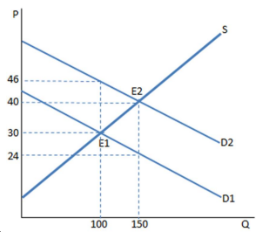
A. As a way to encourage the consumption of the good
B. As a way to encourage consumers to substitute away from the good
C. As a way to discourage the production of the good
D. As a way to discourage the consumption of the good
A. As a way to encourage the consumption of the good
You might also like to view...
Use the figure above to answer this question. Suppose the economy is operating at point a. A move to ________ could be explained by ________
A) point e; a decrease in the nominal interest rate B) point c; an increase in the nominal interest rate C) point d; an increase in real GDP D) point b; an increase in real GDP
Describe the process of "creative destruction" using a specific example
What will be an ideal response?
Figure 11-3
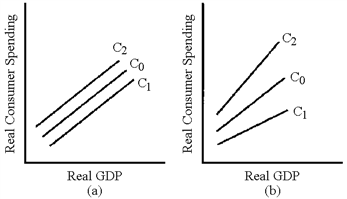
In Figure 11-3, which line represents the change in the consumption schedule caused by an increase in the residential property tax?
a.
C1 in graph (a)
b.
C2 in graph (a)
c.
C1 in graph (b)
d.
C2 in graph (b)
There is a close relationship between changes in a nation's rate of productivity growth and changes in its average real hourly wage because if average real hourly wage and output per worker is
What will be an ideal response?