Graph the inequality.y < -4x + 1
A. 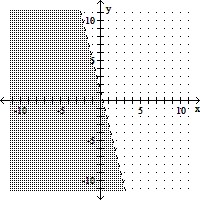
B. 
C. 
D. 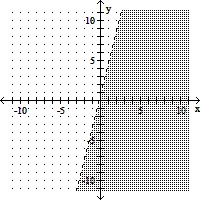
Answer: A
Mathematics
You might also like to view...
Find the volume of the rectangular solid.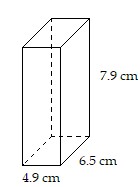
A. V = 70.560 cm2
B. V = 19.3 cm3
C.
| V = 251.615 cm3 |
D. V = 56.25 cm3
Mathematics
Provide an appropriate response.A good statistical indicator to avoid the distortion of extreme values is the:
A. mean B. mode C. median D. weighted mean
Mathematics
Graph the line whose equation is given.y = -  x - 1
x - 1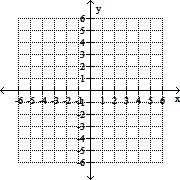
A. 
B. 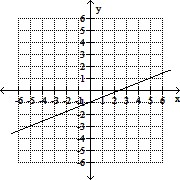
C. 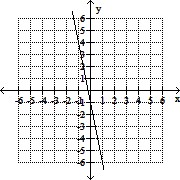
D. 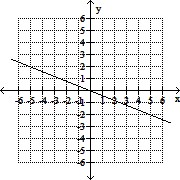
Mathematics
A certain bacterial culture grows in such a way that each hour the increase in the number of bacteria in the culture is 60% of the total number present at the beginning of the hour. Let yn be the number of bacteria in the culture after n hours.If there were 10,000 bacteria originally, then after twenty-four hours the number of bacteria most closely approximates
A. 79,228,162 B. 792,281,625 C. 892,291 D. 89,228,162 E. none of these
Mathematics