The long-run average total cost (LRATC) curve
a. indicates the per-unit cost of producing various rates of output with a specific size of plant but variable levels of labor and technology.
b. indicates the minimum per-unit cost that can be achieved at various output rates when the firm is free to choose among plant sizes.
c. will be falling when diseconomies of scale are present and rising when economies of scale are present.
d. is a U-shaped curve.
e. is both a and d above.
B
You might also like to view...
One argument for having the government regulate natural monopolies is that without regulation ________.
A. the industry would become perfectly competitive and there would be too many firms in the market to achieve efficiency B. these monopolies produce at a level where price is greater than marginal cost C. these monopolies produce at a level where price is less than marginal cost D. these monopolies usually produce things that are potentially harmful to our health
Why do people often tend to take risks if they are insured?
What will be an ideal response?
Assuming a closed economy (i.e., NX = O) the data in Figure 2-1 suggest that for each year after 1980
A) private saving could have been either positive or negative. B) private saving was negative. C) private saving was positive. D) private saving equaled zero.
Figure 10-4
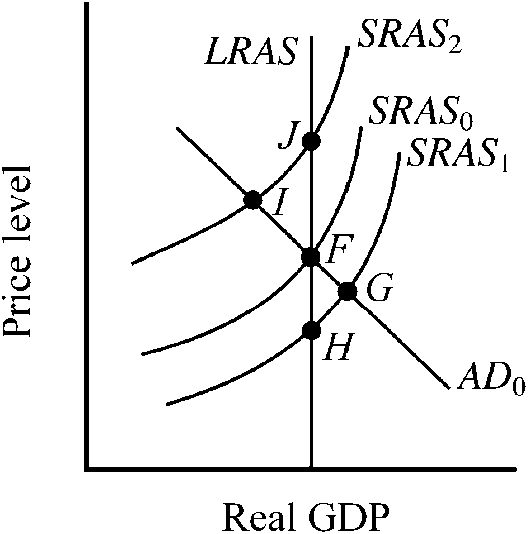
Starting from long-run equilibrium at point F in , at which of the following points would short-run equilibrium occur following a decrease in resource prices?
a.
I
b.
F
c.
G
d.
H