Refer to the information provided in Figure 26.5 below to answer the question(s) that follow.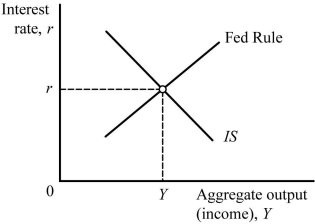 Figure 26.5Refer to Figure 26.5. An increase in the price level shifts the ________ to the ________.
A. IS curve; right
B. Fed rule; left
C. Fed rule; right
D. IS curve; left
Answer: B
You might also like to view...
The interest rate effect that helps explain the slope of the aggregate demand curve arises because
A) an increase in the price level lead to decreases in interest rates, which induces more borrowing and hence raises planned real expenditures. B) interest rates and total planned real expenditures are unrelated. C) an increase in the price level boosts interest rates, which discourages borrowing and hence reduces planned real expenditures. D) a decrease in the price level boosts interest rates, which discourages borrowing and hence frees up income for more planned real expenditures.
Refer to Figure 11.5. A decrease in the level of investment is best illustrated by diagram
A) A. B) B. C) C. D) D.
A liquidity trap occurs when
A) any additions to the monetary base are held as cash by people or reserves at banks. B) the Fed increases the money supply, causing the expected inflation rate to rise more than the real interest rate declines, so that the nominal interest rate increases. C) there are runs on banks that are solvent but illiquid. D) the demand for loans increases in a country on the gold standard, so that the monetary supply is not able to increase and interest rates rise dramatically.
Assume, in a competitive market, price is initially below the equilibrium level. We predict that price will:
A. decrease, quantity demanded will decrease, and quantity supplied will increase. B. increase, quantity demanded will increase, and quantity supplied will decrease. C. decrease and quantity demanded and quantity supplied will both decrease. D. increase, quantity demanded will decrease, and quantity supplied will increase.