Provide an appropriate response.Explain in your own words the difference between a bar graph and a histogram. Give an example of data for which you might use a histogram and an example of data for which you might use a bar graph.
What will be an ideal response?
Answers will vary. Possible answer: A histogram is used for quantitative data, has a continuous numerical scale on the horizontal axis, and there are no gaps between the bars. A bar graph is used to represent qualitative data. It does not have a continuous numerical scale on the horizontal axis, but names of the different categories. There are gaps between the bars. Examples of data will vary.
You might also like to view...
4a/b + 5b/a =
a. (4a + 5b)/ab b. (4ab + 5b)/ab c. (4a2 + 5b2)/ab d. 9a2b2/ab e. 9ab
The graph of an exponential function is given. Match the graph to one of the following functions.
A. f(x) = 3x B. f(x) = 3x - 2 C. f(x) = 3x + 2 D. f(x) = 3x - 2
Determine if the type of relation is linear, nonlinear, or none.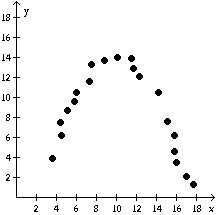
A. none B. nonlinear C. linear
Write the fraction or mixed number as a decimal. Round to the nearest thousandth if necessary.10
A. 10.4 B. 0.096 C. 104 D. 1.04