Use the given table or graph to write the inequality described.The sales figures for the Big "D" Company area shown below in a line plot.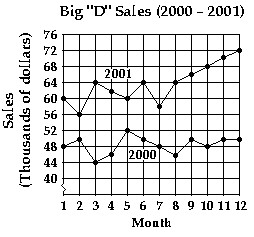 Use an inequality to compare the sales for July 2000 and July 2001.
A. $64,000 > $50,000
B. $50,000 < $64,000
C. $46,000 < $64,000
D. $48,000 < $58,000
Answer: D
You might also like to view...
Solve the problem.Find the value of a retirement savings account with a monthly contribution of $50 (contributions made at the end of each month, including the last month), and an APR of 6.0% (compounded monthly) after  years. Round your answer to the nearest cent.
A. $190,081.91 B. $177,135.09 C. $177,777.83 D. $183,482.05 E. $168,912.35
Calculate the value of the following numerical expression. 2
2
A. 
B. 
C. - 
D. 
Solve the problem. Round your answer to three decimals.What annual rate of interest is required to triple an investment in 7 years?
A. 16.993% B. 8.497% C. 10.409% D. 15.694%
Use the information given about the angle ?, 0 ? ? ? 2?, to find the exact value of the indicated trigonometric function.sin ? = -  ,
,  < ? < 2?Find cos
  .
.
A. - 
B. 
C. - 
D. 