Graph the linear equation.-x = -3y + 7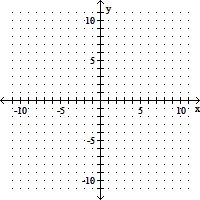
A. 
B. 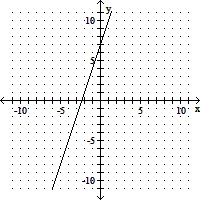
C. 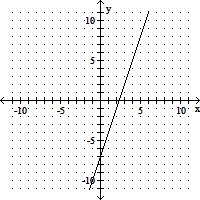
D. 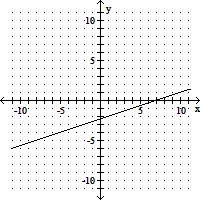
Answer: A
You might also like to view...
Add and simplify. +
+  +
+ 
A. 
B. 
C. 
D. 
Graph the system of inequalities. Shade the region that represents the points of intersection.
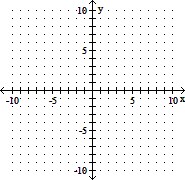
A. 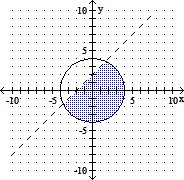
B. 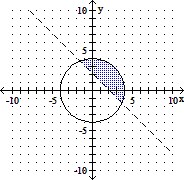
C. 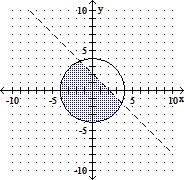
D. 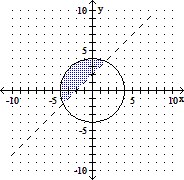
The rectangular coordinates of a point are given. Find polar coordinates of the point. Express ? in radians.(5 , 5)
, 5)
A. 
B. 
C. 
D. 
The following is a sample of the percentage increases in the price of a house in eight regions of the U.S.
?
75, 125, 150, 150, 150, 215, 215, 300
?
Compute the mean of the given sample. Round answer to the nearest whole number.
?
 __________
?
Compute the standard deviation of the given sample. Use the rounded value for the mean in your calculations. Round answer to the nearest whole number.
?
__________
?
Compute the standard deviation of the given sample. Use the rounded value for the mean in your calculations. Round answer to the nearest whole number.
?
 __________
?
Assuming the distribution of percentage housing price increases for all regions is symmetric and bell-shaped, 68 percent of all regions in the U.S. reported housing increases between __________ and __________. Please, use the rounded value for the standard deviation here.
?
Find the percentage of scores in the sample that fall in this range. Please round your answer to the nearest whole number.
?
__________%
What will be an ideal response?
__________
?
Assuming the distribution of percentage housing price increases for all regions is symmetric and bell-shaped, 68 percent of all regions in the U.S. reported housing increases between __________ and __________. Please, use the rounded value for the standard deviation here.
?
Find the percentage of scores in the sample that fall in this range. Please round your answer to the nearest whole number.
?
__________%
What will be an ideal response?