Exhibit 9-1 GDP and consumption data
GDP
Consumption
Aggregate Expenditures
Unplanned inventory
$0
$0.5
1
1.0
2
1.5
3
2.0
4
2.5
5
3.0
6
3.5
7
4.0
8
4.5
As shown in Exhibit 9-1, if investment is $0.5 trillion, government spending is $1 trillion, and net exports are ?$0.5 trillion, then equilibrium GDP is:
A. $2 trillion.
B. $3 trillion.
C. $4 trillion.
D. $5 trillion.
Answer: B
You might also like to view...
When the LM curve is vertically sloped, the __________ in income due to a change in the money supply will be __________ when the LM curve is positively sloped, but not vertical
A) decrease; greater B) decrease; smaller C) increase; greater D) increase; smaller
A common approach that economists use to understand, explain and predict economic phenomena is to
A) form a theory or model. B) conduct experiments in a science lab. C) ask what people think. D) examine people's thought processes.
A utility-maximizing consumer will choose a collection of goods
a. represented by a point below her budget line b. represented by a point above her budget line c. for which the marginal utility from each good is the same d. for which the marginal utility divided by the price is the same or each good e. for which the total utility from each good is the same
Refer to the above diagrams. Which of the following is a feasible rate at which X and Y might be exchanged?
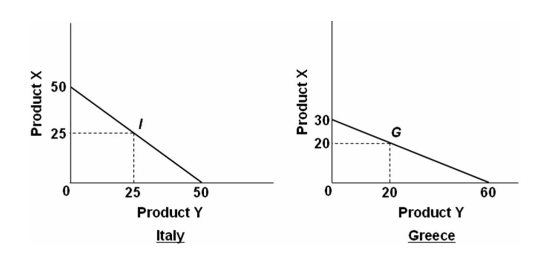
A. 1X for 3Y
B. 1X for 1.5Y
C. 1X for 2.5Y
D. 1X for .5Y