At the current steady state capital-labor ratio, assume that the steady state level of per capita consumption, (C/N)*, is greater than the golden rule level of steady state per capita consumption. Given this information, we can be certain that
A) a reduction in the saving rate will cause a decrease in the steady state level of per capita consumption ((C/N)).
B) an increase in the capital-labor ratio will cause an increase in (C/N).
C) the capital labor ratio will tend to decrease over time.
D) the capital labor ratio will tend to increase over time.
E) a reduction in the saving rate will have an ambiguous effect on (C/N).
E
You might also like to view...
All used cars are lemons or peaches. Owners know whether or not their car is a lemon, but buyers do not; that is, the quality of a car is private information. There are many more buyers than sellers
Buyers value a peach at $4,000 and a lemon at $200; owners value a peach at $3,000 and a lemon at $100 . Owners can have their cars inspected for $100 . If they do have their car inspected, they will receive a certificate that shows whether the car is a lemon or a peach. Show that owners of peaches will have their cars inspected and will sell those cars for $4,000 . Show also that the owners of lemons will not obtain a certificate and will sell their cars for $200 .
When nations trade according to their comparative advantages,
a. one nation has an absolute advantage in producing all goods b. all opportunity costs of production are the same c. world economic efficiency falls d. at least one country is made better off through trade e. at least one country is made worse off through trade
During a football game, it starts to rain and the temperature drops. The senior class, which runs the concession stand and is studying economics, raises the price of coffee from 50 cents to 75 cents a cup. They sell more than ever before. Which answer explains this?
What will be an ideal response?
Figure 18-3
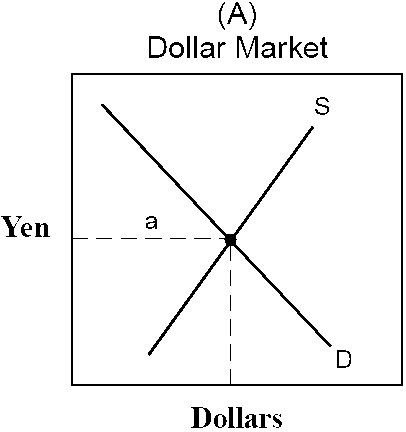
displays the international currency market for yen in terms of dollars and dollars in terms of yen. The supply curve in graph (A) is comprised of
a.
U.S. citizens attempting to purchase Japanese-made goods.
b.
Japanese attempting to purchase U.S.-made goods.
c.
U.S. businesses attempting to sell to the Japanese.
d.
Japanese businesses attempting to sell to the U.S.
e.
the U.S. government attempting to unload dollars to the international market.