Solve the problem.Suppose that the population of a certain city during a certain time period can be modeled with the function, P(x) = -0.1x5 + 3.4x4 + 5000, where x is time in years since 1960. By sketching a graph of P(x), estimate during what time period the population of the city was increasing.
A. Between 1960 and 1974
B. Between 1965 and 1987
C. Between 1987 and 1994
D. Between 1960 and 1987
Answer: D
You might also like to view...
Identify the property illustrated by the statement.(5 + 2) + 6 = (2 + 5) + 6
A. Associative B. Commutative C. Distributive D. Identity E. Inverse
Find the intervals on which the function is continuous.y = 
A. continuous on the interval 
B. continuous on the interval 
C. continuous on the interval
D. continuous on the interval 
Solve the problem.Evaluate 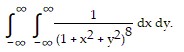
A. 
B. 
C. 
D. 
Solve the problem.If x is the hydrogen ion concentration of a sample of water, then the pH of that water sample is  If the pH of the water from one lake is 7.5 and the pH of the water from a second lake is 8.4, how many times greater is the hydrogen ion concentration of the second lake than the hydrogen ion concentration of the first lake? Round your answer to the nearest hundredth.
A. 7.81 B. 0.13 C. 13.18 D. 7.94