Describe the distributions with a pie chart.The following figures give the distribution of land (in acres) of a county containing 67,000 acres.ForestFarmUrban10,050?6,700?50,250
A. 
B. 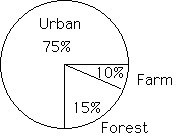
Answer: B
Mathematics
You might also like to view...
Find the limit, if it exists.

A. 1 B. 2 C. 4 D. Does not exist
Mathematics
Solve the problem.The temperature at the South pole was -39°F at 8 am. At 3 pm, it was 10°F. By how many degrees did the temperature rise?
A. by 29°F B. by 49°F C. by -49°F D. by -29°F
Mathematics
Simplify by first converting to rational exponents. Assume that all variables represent positive real numbers.
A. 
B. x17
C. x5.831
D. 
Mathematics
Sketch the graph of the function.y = 
A. 
B. 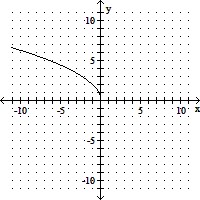
C. 
D. 
Mathematics