The production function in the table below exhibits decreasing marginal returns to capital over what output range? Production Function for Good XL*KQMPK=(?Q/?K)APK=(Q/K)LaborCapitalOutputMarginal Product of CapitalAverage Product of Capital900----910575.75.7092032426.716.2093065733.3B9401,07241.526.809501,52445.230.489601,97645.232.939702,39141.534.169802,72433.334.059902,991A33.2391003,0485.730.4891103,016-3.227.4291202,945-7.124.54
A. Between 0 and 1,524
B. Between 3,016 and 2,945
C. Between 0 and 2,991
D. Between 2,391 and 3,048
Answer: D
You might also like to view...
Which of the following variables will not cause the market supply curve of labor to shift?
A) a change in the labor participation rate of women B) an increase in the number of people between the ages of 16 and 65 C) increases in population D) a favorable change in consumer tastes
The labor force in country XYZ is 10,000,000 and the number of employed is 7,000,000. Calculate the number of unemployed and the unemployment rate
What will be an ideal response?
Along a downward-sloping money demand schedule, as the interest rate falls
A) the quantity of money demanded falls. B) the quantity of money demanded rises. C) real income rises. D) real income falls.
Refer to the figure shown, which represents the production possibilities frontiers for Countries A and B. Considering both country's production possibilities frontiers, we can infer that Country A will specialize in:
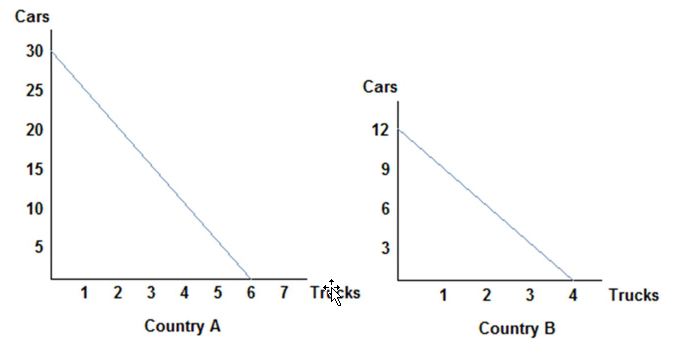
A. trucks, and be willing to accept no less than 5 cars for each truck.
B. cars, and be willing to give no more than 5 cars for each truck.
C. trucks, and be willing to accept no more than 5 cars for each truck.
D. cars, and be willing to give no less than 5 cars for each truck.