In a simple linear regression model, wage =  +
+ ![]()
data-mathml="%3Cmath%20style%3D%22font%2Dfamily%3A%27Times%20New%20Roman%2C%20serif%27%22%20xmlns%3D%22http%3A%2F%2Fwww%2Ew3%2Eorg%2F1998%2FMath%2FMathML%22%3E%3Cmstyle%20mathsize%3D%2215px%22%3E%3Cmsub%3E%3Cmi%3E%26%23946%3B%3C%2Fmi%3E%3Cmn%3E1%3C%2Fmn%3E%3C%2Fmsub%3E%3C%2Fmstyle%3E%3C%2Fmath%3E" src="@@PLUGINFILE@@/ppg__cognero__Ch_02_The_Simple_Regression_Model__media__1bf590d6-a2ba-4841-b79e-97ddde25877f.PNG" style="vertical-align: middle;" />male + u, where male is a binary variable (1 if a person is male, and 0 otherwise), is the difference in the average wage between males and non-males.
Answer the following statement true (T) or false (F)
True
Rationale:
 = E(wage|male = 1) - E(wage|male = 0) . In words,
  is the difference in the average wage between males and non-males.
You might also like to view...
Income that flows to the private sector for services and production is called
A) national income. B) net income. C) derived income. D) deficit income.
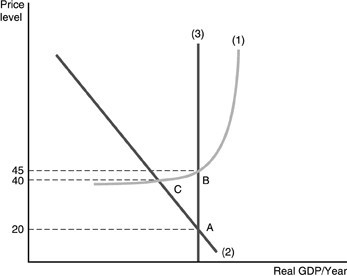 The three curves in the above figure are
A. (1) the short-run aggregate supply curve, (2) the aggregate demand curve, and (3) the long-run aggregate supply curve. B. (1) the long-run aggregate supply curve, (2) the aggregate demand curve, and (3) the short-run aggregate supply curve. C. (1) the aggregate supply curve, (2) the short-run aggregate demand curve, and (3) the long-run aggregate demand curve. D. (1) the long-run aggregate supply curve, (2) the short-run aggregate supply curve, and (3) the aggregate demand curve.
In the years immediately prior to 2005 in the U.S.,
A. home prices were rising briskly. B. home prices were falling precipitously. C. bankers were confident that home prices would decrease in 2005. D. home prices were constant.
Refer to Figure 17.1. What is the output level where the average cost is at its minimum?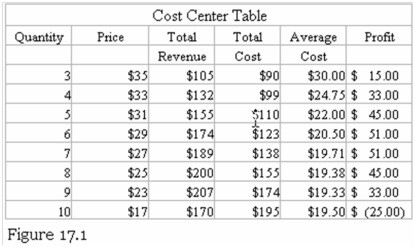
A. 7 units B. 6 units C. 8 units D. 9 units