Using Figure 1 above, if the aggregate demand curve shifts from AD2 to AD1 the result in the long run would be: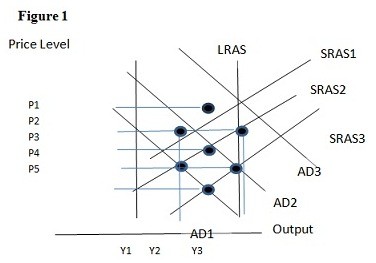
A. P4 and Y1.
B. P4 and Y2.
C. P5 and Y1.
D. P5 and Y2.
Answer: D
You might also like to view...
Explain why in cities such as New York City that have rent ceiling laws, so many people who work in the city commute from outside the city
What will be an ideal response?
What most accurately describes the ratio of federal employment of the total labor force between 1910 and 2007?
a. Between 1930 and 1945 the federal labor force grew dramatically, but after World War II it shrank below pre-Depression levels. b. Since 1910, federal employment has increased consistently at the rate of about 3% per year. c. Between 1910 and 1950 federal employment dropped dramatically, but after 1950 it grew consistently. d. The share of federal employment in the total labor force peaked briefly above four percent during the Korean War, and then began a steady decline to about the same level as the 1930s.
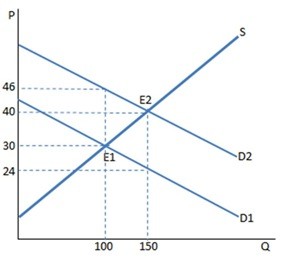 Assume a subsidy to buyers has been enacted in the market in the graph shown. With the subsidy, the buyers buy ________ units and pay ________ for each of them.
A. 100; $46 B. 100; $30 C. 150; $24 D. 150; $40
One type of explicit price-fixing is known as price leadership.
Answer the following statement true (T) or false (F)