A graph that illustrates the maximum amount of one good that can be produced for every possible level of production of the other good is called a:
A. production possibilities curve.
B. production function.
C. consumption possibilities curve.
D. supply curve.
Answer: A
You might also like to view...
Suppose a bank has $100 million in checking account deposits with no excess reserves and the required reserve ratio is 10 percent. If the Federal Reserve reduces the required reserve ratio to 8 percent, then the bank can make a maximum loan of
A) $0. B) $2 million. C) $8 million. D) $10 million.
A monopoly firm is a price
a. taker and has no supply curve. b. maker and has no supply curve c. taker and has an upward-sloping supply curve. d. maker and has an upward-sloping supply curve.
The income effect and the substitution effect offset each other at point
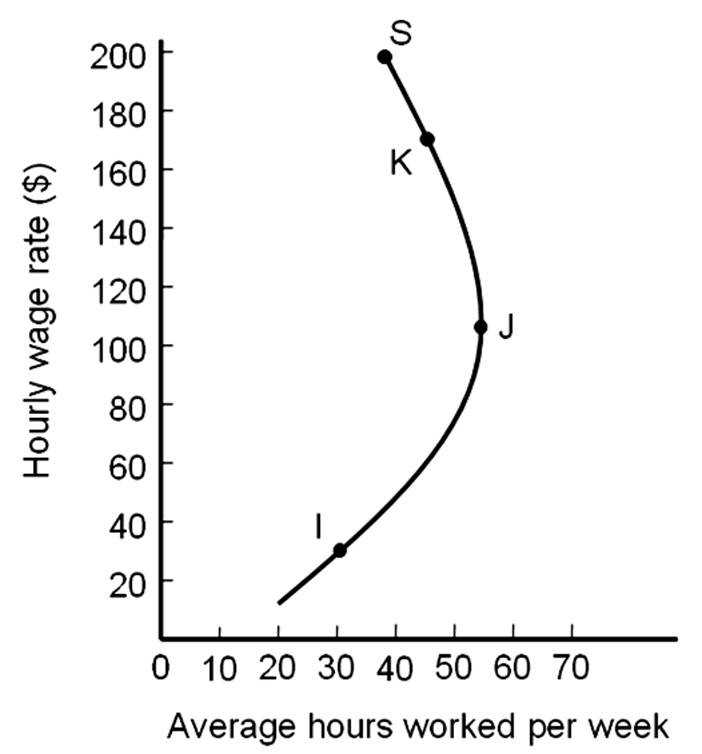
A. I.
B. J.
C. K.
D. S.
Using a production possibilities curve, a technological advance that increases the amount of output for the same amount of inputs would be illustrated as a(n):
A. flattening of the curve. B. movement from one point to another point along the curve. C. outward shift of the curve. D. movement from a point on the curve to a point inside the curve.