Express the graph shown using interval notation. Also express it as an inequality involving x.
A. [-2, 5]
-2 ? x ? 5
B. (-2, 5)
-2 < x < 5
C. [-2, 5)
-2 ? x < 5
D. (-2, 5]
-2 < x ? 5
Answer: C
You might also like to view...
Identify the inequality as true or false.- 1 ? - 6
A. True B. False
Find decimal notation for the number(s) in percent notation. Shares of Stock Owned by an Investor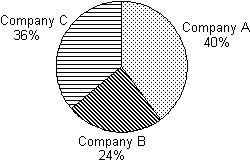
A. 36.0; 40.0; 24.0 B. 0.36; 0.4; 0.24 C. 3.6; 0.4; 2.4 D. 0.036; 0.04; 0.024
Subtract.
A. 57,365 B. 55,359 C. 55,365 D. 55,299
Solve the problem.Economists use what is called a Leffer curve to predict the government revenue for tax rates from 0% to 100%. Economists agree that the end points of the curve generate 0 revenue, but disagree on the tax rate that produces the maximum revenue. Suppose an economist produces this rational function 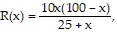 where R is revenue in millions at a tax rate of x percent. Use a graphing calculator to graph the function. What tax rate produces the maximum revenue? What is the maximum revenue?
A. 30.9%; $382 million B. 38.4%; $383 million C. 27.0%; $379 million D. 28.8%; $272 million