The table shows election data for a hypothetical state in two different years (before and after redistricting). The table shows the vote counts for all House districts in the state in each of the two years. Votes for parties other than Republican and Democrat are neglected. Find the percentage of votes cast for Republican and Democratic House candidates before and after redistricting. Find the percentage of House seats that were won by Republican and Democratic candidates before and after redistricting. Did the distribution of House seats better reflect the distribution of votes before or after redistricting?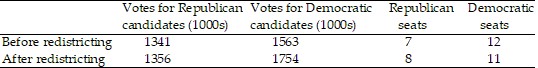
What will be an ideal response?
Votes:
Before redistricting: Republican 46%, Democrat 54%;
After redistricting: Republican 44%, Democrat 56%;
Seats:
Before redistricting: Republican 37%, Democrat 63%;
After redistricting: Republican 42%, Democrat 58%;
The distribution of House seats better reflects the distribution of votes after redistricting.
You might also like to view...
Find v ? u.v = 5i - 3j and u = -8i - 7j
A. -3i - 10j B. -40i + 21j C. -61 D. -19
Add the polynomials.(y4 + y) + (9 - y +  y2)
y2)
A. y4 +  y2 + 2y + 9
B. y4 +  y2 + 9
C. y4 +  y2 - 2y + 9
D. y4 +  y2 - 9
Determine the upper and lower bounds on the zeros of the given function.F(x) = 3x4 - 8x3 - 8x - 9
A. upper bound: 2; lower bound: -2 B. upper bound: 1; lower bound: -1 C. upper bound: 1; lower bound: -2 D. upper bound: 4; lower bound: -1
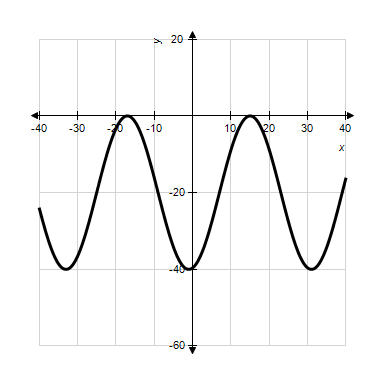
Model the curve with a sine function.
?
?
Note that the period of the curve is  and its range is
  , the graph of the sine function is shifted to the right 7 units.
?
A. 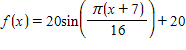
B. 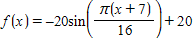
C. 
D. 
E. 