Refer to the information provided in Table 3.2 below to answer the question(s) that follow.Table 3.2Price per CheeseburgerQuantity Demanded (Cheeseburgers per Month)Quantity Supplied (Cheeseburgers per Month)$51,500 500 61,200 700 7 900 900 8 6001,100 9 3001,300Refer to Table 3.2. In this market there will be an excess supply of 1,000 cheeseburgers at a price of
A. $5.
B. $6.
C. $7.
D. $9.
Answer: D
You might also like to view...
In an industry with free entry and exit, positive economic profit:
A. indicates a market failure. B. can be sustained indefinitely. C. cannot be sustained indefinitely. D. can never occur.
The Solow model is used to explain ________
A) why some economies experience higher rates of growth than others B) the relationship between price and quantity demanded C) the relationship between the rate of inflation and the rate of unemployment D) the notion of opportunity cost
According to the graph shown, the monopolistically competitive firm:
These are the cost and revenue curves associated with a monopolistically competitive firm.
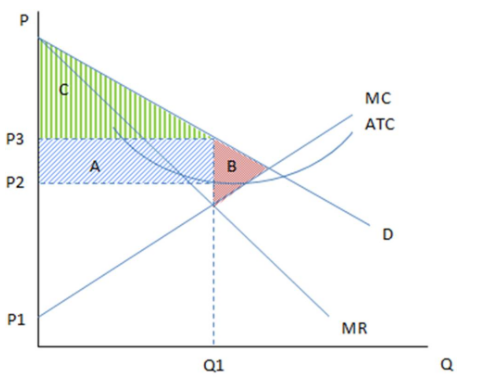
A. will cause deadweight loss equal to area C.
B. will earn profits equal to area B.
C. should act like a monopolist in the short run.
D. should leave the industry in the long run.
Which of the following will cause consumption to increase and aggregate demand to shift to the left?
a. an optimistic business forecast of future income growth b. increased consumer wealth c. an increase in consumer confidence d. none of the above