Analyze the graph of the given function f as follows:(a) Determine the end behavior: find the power function that the graph of f resembles for large values of |x|.(b) Find the x- and y-intercepts of the graph.(c) Determine whether the graph crosses or touches the x-axis at each x-intercept.(d) Graph f using a graphing utility.(e) Use the graph to determine the local maxima and local minima, if any exist. Round turning points to two decimal places.(f) Use the information obtained in (a) - (e) to draw a complete graph of f by hand. Label all intercepts and turning points.(g) Find the domain of f. Use the graph to find the range of f.(h) Use the graph to determine where f is increasing and where f is decreasing.f(x) = -x2(x - 1)(x + 3)
What will be an ideal response?
(a) For large values of |x|, the graph of f(x) will resemble the graph of y = -x4.
(b) y-intercept: (0, 0), x-intercepts: (-3, 0) , (0, 0), and (1, 0)
(c) The graph of f crosses the x-axis at (1, 0) and (-3, 0) and touches the x-axis at (0, 0).
(e) Local maxima at (-2.19, 12.39) and (0.69, 0.55); Local minimum at (0, 0)
(f) 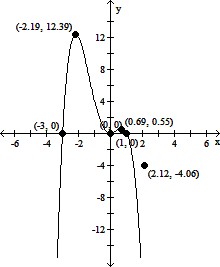
(g) Domain of f: all real numbers; range of f: (-?, 12.39]
(h) f is increasing on (-?, -2.19) and (0, 0.69); f is decreasing on (-2.19, 0) and (0.69, ?)
You might also like to view...
Write the interval as an inequality involving x. Graph the inequality.[-5, -1)![]()
A. -5 < x ? -1![]()
B. -5 ? x < -1![]()
C. -5 < x < -1![]()
D. -5 ? x ? -1![]()
Provide an appropriate response.What is wrong with the following problem? Explain and correct the error.  =
=

What will be an ideal response?
Find all values of x (if any) where the tangent line to the graph of the function is horizontal.y = x8 + 
A. 9
B. None
C. 0
D. - 
Find the sum of the finite geometric sequence. (Round your answer to three decimal places.)
?
 ?
?
A. 2,092.596 B. 1,691.128 C. 340.518 D. 352.212 E. 1,312.385