Forecasts based on an economic theory as opposed to historical data are called
A) causal econometric forecasts.
B) non-time-series forecasts.
C) dummy forecasts.
D) explanatory variable forecasts.
A
You might also like to view...
Assume thatthe market demand for organic tomatoesis modeled as QD= 104 – 2P and market supply is QS = 20 + 4P. If the actual price is set at $20 per pound, there is a _________ of _______ units of the good.
a. surplus; 36 c. shortage; 10 b. surplus; 26 d. none of the above
Because of increasing marginal cost, most supply curves
A) are horizontal. B) are vertical. C) have a negative slope. D) have a positive slope.
What is quantitative easing? What was the Fed's objective in implementing quantitative easing?
What will be an ideal response?
Refer to the graph below. 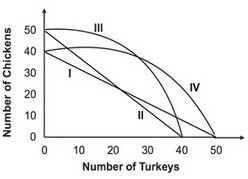 Suppose that the opportunity cost of producing 10 chickens is always 8 turkeys. Given this, the relevant production possibility curve must be:
A. I. B. II. C. III. D. IV.