Solve the problem.The graph shows the increase in dental contacts per person from 1990 to 1998.Dental Contacts Per Person
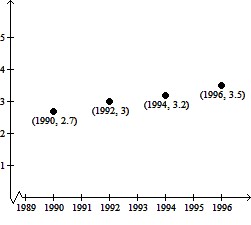 YearAssume that the rate of increase continues for the next several years. Using the average yearly increase from 1990 to 1996 to find a linear model, predict the number of dental contacts per person in 2008.
A. 7.10
B. 2.83
C. 5.10
D. 5.60
Answer: C
Mathematics
You might also like to view...
Solve the problem.Solve for a: 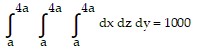
A. a = 
B. a = 4
C. a = 2
D. a = 
Mathematics
Determine whether or not the graph is a graph of a function of x.
A. Function B. Not a function
Mathematics
Shade the portion of the diagram that represents the given set.(A ? B) ? 

A. 
B. 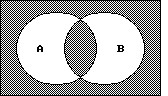
Mathematics
Divide. Write the answer in lowest terms and as a whole or mixed number where possible.24 ÷ 
A. 24
B. 3
C. 168
D. 
Mathematics