The line graph shows the pollution rate for a certain lake over six decades. Use the graph to answer the question. 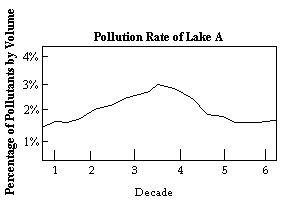 Find an estimate for the pollution rate of the lake at the beginning of decade 6.
A. 1.5%
B. 3%
C. 1%
D. 2.5%
Answer: A
Mathematics
You might also like to view...
Provide an appropriate response.Perform the division: 
A. 2x2 + 4x B. 2x2 + 4x - 1 C. 3x2 + 9x D. 2x3 + 4x2 - x
Mathematics
Determine whether the sequence is arithmetic.an = 4 - 
A. Arithmetic B. Not arithmetic
Mathematics
Simplify the exponential expression. Assume that variables represent nonzero real numbers. -2
-2
A. 
B. 
C. 
D. 
Mathematics
Graph the function.f(x) = 
A. 
B. 
C. 
D. 
Mathematics