The following table shows federal expenditures E, in billions of dollars, on Medicare t years after 2004.
t0234 E269.96298.14329.09375.61A: Find the equation of the regression line.B: Plot the data along with the regression line.C: Explain in practical terms the meaning of the slope of the regression equation.D: What expenditure does the regression line predict for 2010?
What will be an ideal response?
A: 
?
B:
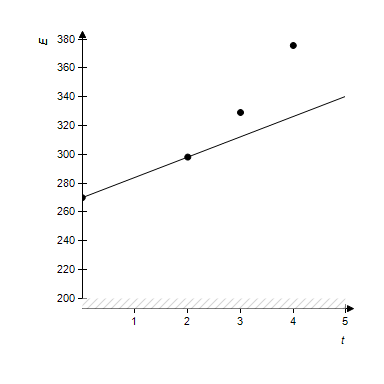
?
C: During the period from 2004 to 2007, federal Medicare expenditures increased by about 25.39 billion dollars each year.
?
D: 413.40 billion dollars
Mathematics
You might also like to view...
Write an equation that models the conditions, then to solve the equation.22 is 5% of what number?
A. 440 B. 44 C. 110 D. 4400
Mathematics
Fill in the digits for the given place values in the following whole number.71,756thousands tens
A. Thousands 7, tens 6 B. Thousands 1, tens 5 C. Thousands 5, tens 6 D. Thousands 1, tens 7
Mathematics
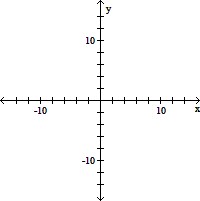
Graph the inequality.x + 2y ? 5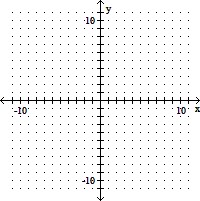
A. 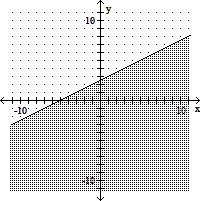
B. 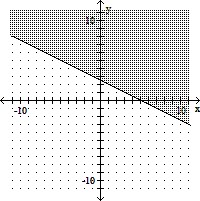
C. 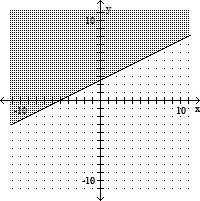
D. 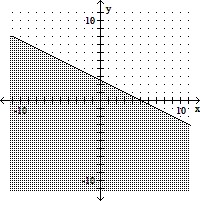
Mathematics
Graph the function using transformations.f(x) = 6 - 
A. 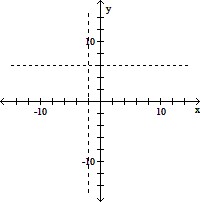
B. 
C. 
D. 
Mathematics