The following triple line graph reflects the crime statistics gathered for a certain city. Use the graph to answer the following question(s).
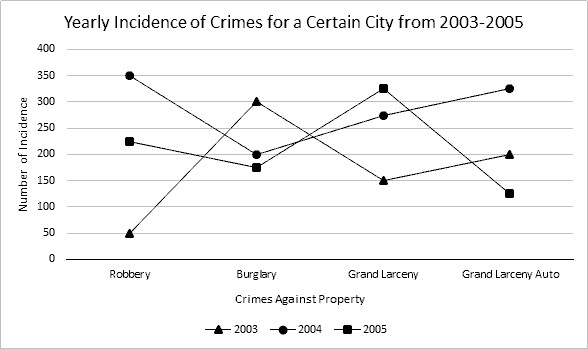 Which year saw grand larceny auto and burglary reach their lowest levels?
A. 2002
B. 2004
C. 2005
D. 2003
Answer: C
Mathematics
You might also like to view...
Simplify the expansion.(4 ? 101) + (5 ? 100)
A. 45 B. 450 C. 54 D. 540
Mathematics
Find the exact value of the expression.sin 20° cos 100° + cos 20° sin 100°
A. 
B. 
C. - 
D. - 
Mathematics
Solve the problem. Find the exact value of x in the figure.
A. 
B. 75
C. 
D. 
Mathematics
Determine whether or not the relationship shown in the table is a function.Does the table define the price of a home that a particular family can afford as a function of the percent down payment?
A. Yes B. No
Mathematics