Solve the problem.The table shows the population of a city over the past five years. 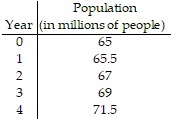 We used this data to develop the quadratic function
 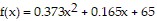 , which models the population of the city y in millions in the year x. Use the model to find the estimated population in year 9.
A. 1,490,000
B. 66,822,000
C. 1,490,000,000,000
D. 65,538,000
Answer: B
You might also like to view...
Find the standard deviation for the given data. Round your answer to one more decimal place than the original data.The numbers listed below represent the amount of precipitation (in inches) last year in six different U.S. cities. 19.9?18.8?35.4?33.4?11.0?11.3Compute the standard deviation s.
A. 2808.0 in. B. 3366.9 in. C. 34.4 in. D. 10.57 in.
Find the equation for the hyperbola described.Center at (0, 0); focus at (- , 0); vertex at (-7, 0)
A.  -
-  = 1
= 1
B.  -
-  = 1
= 1
C.  -
-  = 1
= 1
D.  -
-  = 1
= 1
Find the domain of the rational function.f(x) = 
A. all real numbers B. {x|x ? 0, x ? -16} C. {x|x ? -4, x ? 4} D. {x|x ? -4, x ? 4, x ? -7}
A lawn sprinkler is located at the corner of a yard. The sprinkler is set to rotate through 90 and project water out 50 feet. What is the area (rounded to three significant digits) of the yard watered by the sprinkler?
?
and project water out 50 feet. What is the area (rounded to three significant digits) of the yard watered by the sprinkler?
?
A. 1,960 feet2 B. 2,000 feet2 C. 1,940 feet2 D. 1,990 feet2 E. 1,970 feet2