The line graph shows the recorded hourly temperatures in degrees Fahrenheit at an airport. 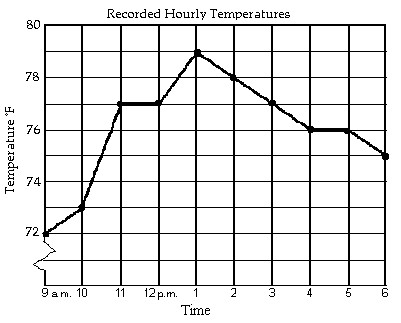 During which hour did the temperature increase the most?
A. 12 p.m. to 1 p.m.
B. 1 p.m. to 2 p.m.
C. 9 a.m. to 10 a.m.
D. 10 a.m. to 11 a.m.
Answer: D
You might also like to view...
Solve the problem.Suppose that the amount in grams of a radioactive substance present at time t (in years) is given by A(t) = 250e-0.88t. Find the rate of change of the quantity present at the time when 
A. 80.4 grams per year B. -80.4 grams per year C. -2.7 grams per year D. 2.7 grams per year
Use the distributive property to rewrite the expression. Do not find the product.4(1 + 6)
A. 4 + 1 + 6 B. 4 ? 1 + 6 C. 4 ? 1 ? 6 D. 4 ? 1 + 4 ? 6
Solve the problem.The image of a figure under the translation that takes P to P' is shown. Find the original figure. Note again, the given figure is the image after translation.
A. 
B. 
C. 
D. 
Use a graphing utility to find the equation of the line of best fit. Round to two decimal places, if necessary.Two different tests are designed to measure employee productivity and dexterity. Several employees are randomly selected and tested with these results.

A. y = 5.05 + 1.91x B. y = 75.3 - 0.329x C. y = 10.7 + 1.53x D. y = 2.36 + 2.03x