The diagram shows the short-run average total cost curves for five different plant sizes of a firm. The position of these five curves in relation to one another reflects:
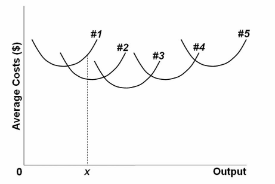
A. economies and diseconomies of scale.
B. the effect of fixed costs on ATC as output increases.
C. the law of constant costs.
D. the law of diminishing returns.
A. economies and diseconomies of scale.
You might also like to view...
When the nominal interest rate rises, the opportunity cost of holding money
A) rises and people hold more money. B) falls and people hold less money. C) falls and people hold more money. D) rises and people hold less money.
Poorly defined property rights imply that _____
a. people can play their music as loud as they would like b. profit opportunities exist for entrepreneurs c. a Pareto optimum is still easily achieved d. people may be able to use resources without paying for them
When the economy is at its potential output level, which of the following is true? a. The price level is higher than that expected by workers. b. The nominal wage is equal to the real wage
c. The unemployment rate is about 14 percent. d. The economy is producing its maximum sustainable output. e. The actual price level is less than the expected price level.
In a competitive market, when price is below the equilibrium level, the price will be driven upward due to
a. excess supply b. government intervention c. competition among suppliers d. excess demand e. technical inefficiency