The following table shows the relationship between output and the total cost of production for a firm.OutputTotal Cost0$40016002760390041,04051,220This firm has a U-shaped
A. average fixed cost curve.
B. total variable cost curve.
C. total cost curve.
D. marginal cost curve.
Answer: D
You might also like to view...
Janet Yellen, Chair of the Federal Reserve, must choose whether tomorrow she meets with the Secretary of the Treasury or with the Congress regarding the financial crisis. This choice reflects the
A) fact that Ms. Yellen faces scarcity. B) concept of entrepreneurship. C) fact that Ms. Yellen responds to incentives. D) use of capital.
How will an increase in the world price of crude oil influence the economy of an oil-importing country such as the United States?
a. Aggregate supply will decrease, leading to a decrease in real GDP. b. Aggregate supply will increase, leading to an increase in real GDP. c. Aggregate supply will increase, leading to an increase in prices and smaller GDP. d. A change in the price of an imported good will not affect the domestic economy of an oil-importing country.
Refer to the graphs shown.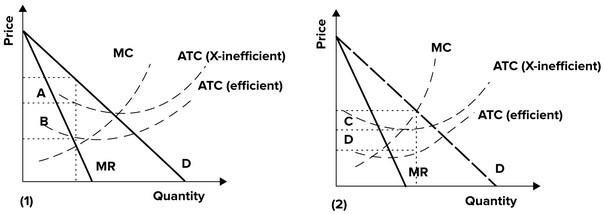 The maximum profits that a lazy monopolist whose average total costs are given by the ATC (X-inefficient) curve but who still produces the profit-maximizing quantity might earn is best shown by the area:
A. C + D in graph (2). B. C in graph (2). C. A+ B in graph (1). D. A in graph (1).
In general, pollution exists if
A) people are unconcerned about the hazards associated with pollution. B) there are poorly defined private property rights. C) there are poorly defined common property rights. D) profit-making activity is taken to an extreme.