The pie chart below shows the number of pizzas consumed by college students in a typical month. Use the chart to answer the question. 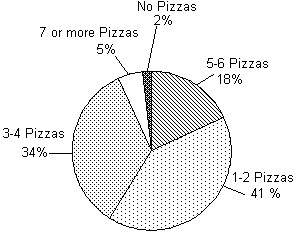 If State University has approximately 28,000 students, about how many would you expect to consume 5-6 pizzas in a typical month?
A. 9520 students
B. 504 students
C. 5040 students
D. 952 students
Answer: C
Mathematics
You might also like to view...
Graph the solution set of the system of inequalities.y ? 2x - 2x + y ? -2
A. 
B. 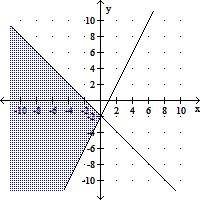
C. 
D. 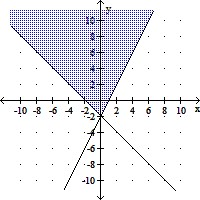
Mathematics
Find the distance between the two given points.(-1, -4) and (-4, -8)
A. 5 B. 10 C. 25 D. 6
Mathematics
Solve the system of equations graphically. Round to the nearest hundredth when appropriate.x + y = 1x - y2 = 3
A. (-0.56, 2.56), 
B. (-0.56, 1.56), 
C. (-0.56, -2.56), 
D. No real solutions
Mathematics
Graph the function.y = ln (-3x)
A. 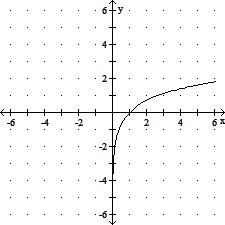
B. 
C. 
D. 
Mathematics