Use the following diagrams for the U.S. economy to answer the next question.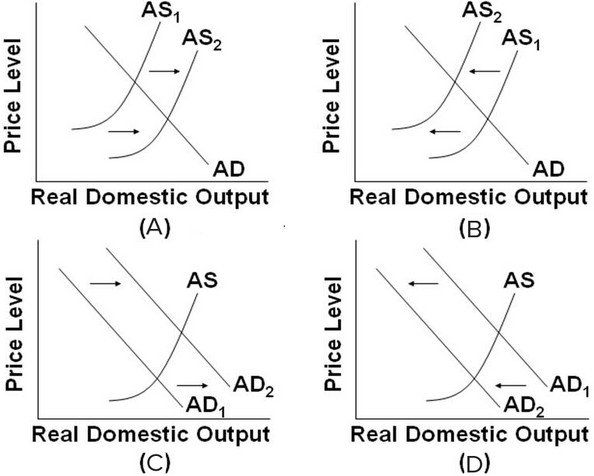 Which of the diagrams best portrays stagflation?
A. Graph A
B. Graph B
C. Graph C
D. Graph D
Answer: B
You might also like to view...
The long-run aggregate supply curve is ________, while the long-run Phillips curve is ________
A) vertical; also vertical B) positively sloped; negatively sloped C) positively sloped; positively sloped D) vertical; negatively sloped
The aggregate demand curve is drawn downward-sloping, because increases in the price level cause decreases in:
a. unemployment. b. total spending (real GDP). c. households' savings. d. the value of the dollar.
Economists at which administrative department help design tax policy?
Suppose the banks in the Federal Reserve System have $1 billion in transactions accounts and the reserve requirement is 0.20. Ceteris paribus, if the reserve requirement is increased to 0.25, then excess reserves will:
A. Increase by $250 million. B. Increase by $50 million. C. Decrease by $250 million. D. Decrease by $50 million.